The guide on how to overthink process enumeration in Linux.
I am coming from the Windows heavy internals background, however, Linux has been always super interesting to me. This is where I started, back in the day doing some heavy auditd stuff here and there. It is time that I have decided to get back to Linux and share something that might help or inspire others.
Why the f.. would you want to enumerate processes? Well, this would be the case of your typical recon phase once you got into the host. You can find some interesting stuff… From the maldev point of view, you usually want to enumerate processes to find some juicy targets for potential process injection (that’s what you do in Windows world, so I assume that would be also valid in Linux land, lol, idk).
In Linux you can just simply utilize tools like ps or pstree in order to enumerate the process. That’s soooo boring, this is freaking maldev isn’t it? You build this sh*t from ground up…
Better… Do it in assembly… ;) because why not? I like pain too.
The code will be just printing all process names with pids, not really that fancy for now, in the future we might try to look at some memory regions of the processes and write to them… for now we are going just to re-create ps with NASM.
Couple of things you need to know
- Trying to make it super simple: we do it in x64, so we need to comply with Linux Calling Convention.
First six arguments passed in RDI, RSI, RDX, RCX, R8, R9 (in this order).
Seventh and beyond on stack. (This is quite scary so let's limit ourselves to 6 arguments)
- There is this pseudo/dynamic/crazy
/procdirectory that kernel builds dynamically that you can read to learn about all processes:
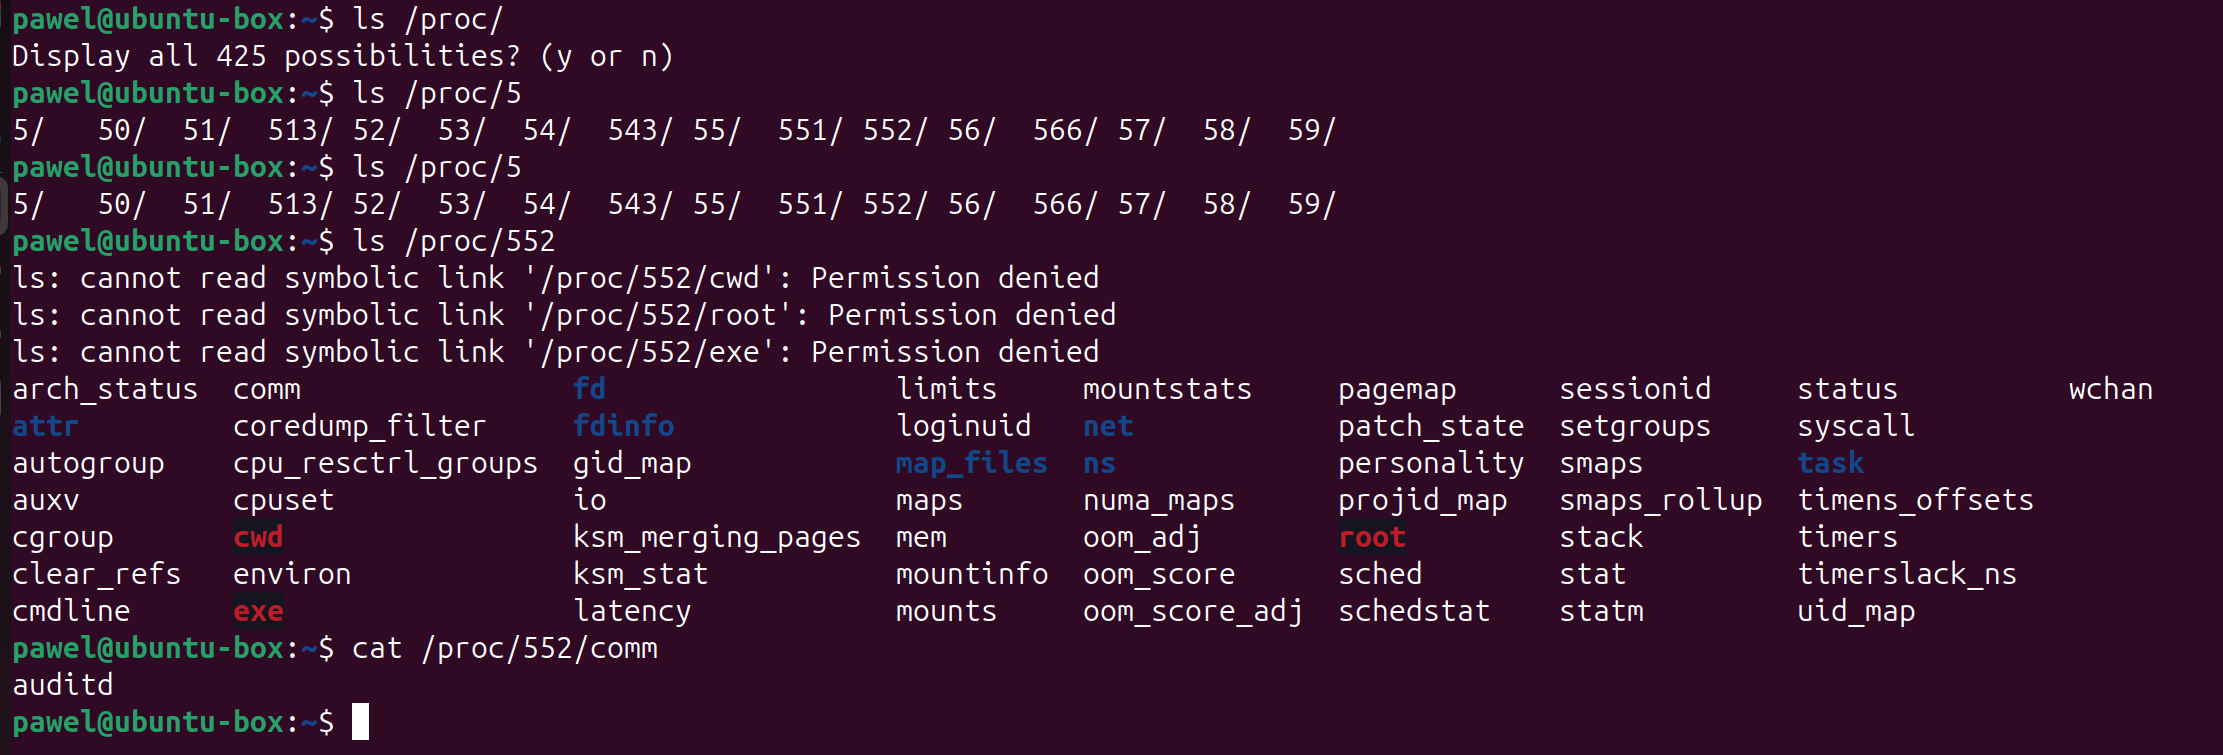
For our usage it is important to know that the pattern is
/proc/<PID>/comm. Reading this file gives us command name associated with the process. man page. Super easy, we just need to traverse the directory and read allcommfiles.We will utilize syscalls heavily. TBH, it is a matter of setting up arguments/parameters call appropriate syscall, work with the provided output, repeat. It is that simple.
You might recall also there is this SSN in Windows that could change across different builds/versions of Windows, thus you usually need to dynamically resolve it.
So you need to do a lot of work, parsing and stuff.
Fortunately for us, Linus is a beast and says that in Linux these numbers are not going to change.
[...]
Most interfaces (like syscalls) are expected to never change and always be available.
We can just hardcode these bad boys!
- There is a lot of online docs you can find that will give you list of syscalls and their numbers, do exploring, but in case you lost:
ausyscall x86_64 --dump
The Code
; code to perform process enumeration, lists all processes and their PIDs
; uses only syscalls just for lolz
; I <3 asm
global _start

%define BUF_SIZE 1024

;macro to print
%macro print 2
    xor rax, rax
    inc rax
    xor rdi, rdi
    inc rdi
    mov rsi, %1
    mov rdx, %2
    syscall
%endmacro

section .data
    proc_dir    db "/proc", 0
    proc_prefix db "/proc/"
    proc_prefix_len equ $-proc_prefix
    comm_suffix db "/comm", 0
    comm_suffix_len equ $-comm_suffix
    separator   db " - "
    newline     db 10

section .bss
    buffer      resb 1024           ; getdents64 buffer
    path_buf    resb 256
    comm_buf    resb 256

section .text
_start:
    mov rax, 2
    mov rdi, proc_dir
    mov rsi, 0x10000    ; O_RDONLY | O_DIRECTORY
    xor rdx, rdx
    syscall

    test rax, rax
    js .exit
    mov r12, rax

.read_dir:
    mov rax, 217        ; sys_getdents64
    mov rdi, r12
    mov rsi, buffer
    mov rdx, BUF_SIZE
    syscall

    test rax, rax
    jle .close
    mov r13, rax
    mov r14, buffer

.parse_entries:
    test r13, r13
    jle .read_dir

    lea r15, [r14 + 19]
    xor rbx, rbx

.check_pid:
    mov al, byte [r15 + rbx]
    test al, al
    je .good_pid ; found null terminator

    cmp al, '0'
    jl .next_entry
    cmp al, '9'
    jg .next_entry

    inc rbx
    jmp .check_pid

.good_pid:
    test rbx, rbx
    je .next_entry

    ;print pid
    print r15, rbx

    ;print sep
    print separator, 3

   ; setting up print buf
    lea rdi, [rel path_buf]


    lea rsi, [rel proc_prefix]
    mov rcx, proc_prefix_len
    rep movsb

    mov rsi, r15
    mov rcx, rbx
    rep movsb

    lea rsi, [rel comm_suffix]
    mov rcx, comm_suffix_len
    rep movsb

    ;checking comm file
    mov rax, 2          ; sys_open
    lea rdi, [rel path_buf]
    xor rsi, rsi        ; O_RDONLY (0)
    xor rdx, rdx
    syscall

    test rax, rax
    js .fail ; if fails the proc has probably died

    mov r8, rax

    ; read comm file
    xor rax, rax        ; sys_read
    mov rdi, r8
    lea rsi, [rel comm_buf]
    mov rdx, 255
    syscall

    mov r9, rax

    ; close comm file
    mov rax, 3          ; sys_close
    mov rdi, r8
    syscall

    test r9, r9
    jle .fail ; If read failed or empty, print newline

    ;print proc name
    lea rsi, [rel comm_buf]
    print rsi, r9
    jmp .next_entry

.fail:
    ;edge case when current proc just dead
    lea rsi, [rel newline]
    print rsi, 1
    syscall

.next_entry:
    movzx rcx, word [r14 + 16]
    add r14, rcx
    sub r13, rcx
    jmp .parse_entries

.close:
    mov rax, 3          ; sys_close
    mov rdi, r12
    syscall

.exit:
    mov rax, 60         ; sys_exit
    xor rdi, rdi        ; status 0
    syscall
Build:
nasm -f elf64 proc.asm -o proc.o
ld proc.o -o proc
Output:
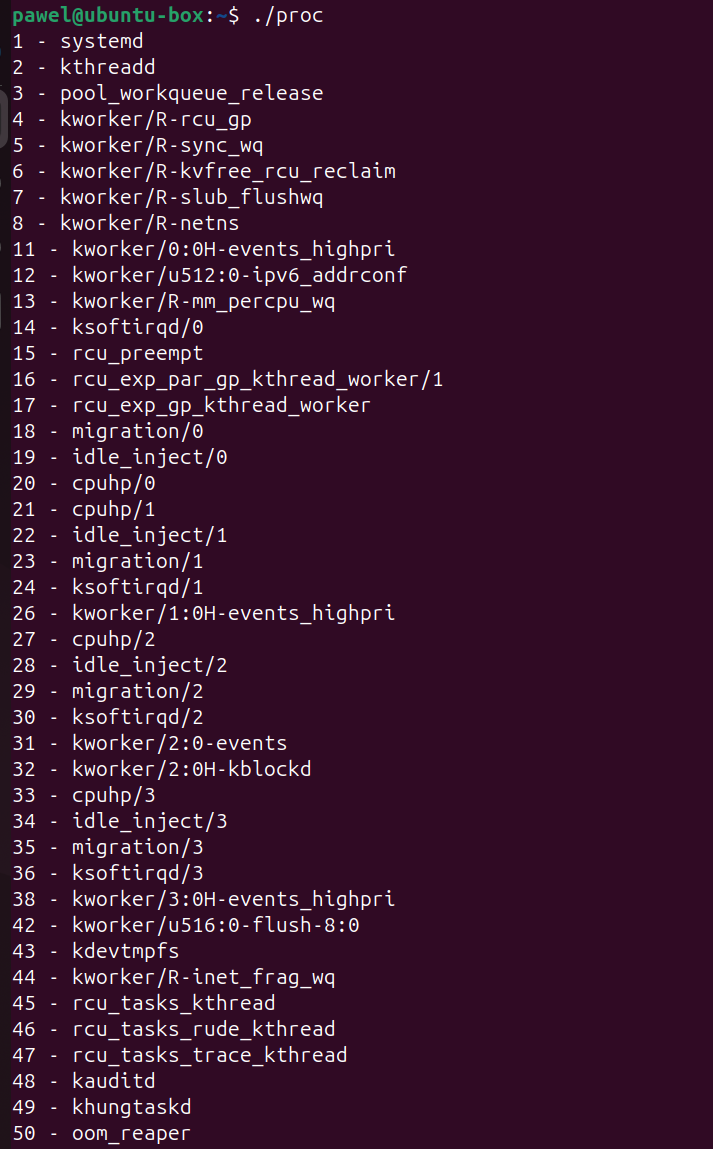
Awesome we can see all the processes with corresponding PIDs listed.
Couple of notes:
You load “syscall number” into the rax prior the syscall instruction.
Utilized syscalls:
readto read the contents of/proc/<PID./commwriteto print outputs to stdoutopento open/procand/proc/<PID>/commcloseto close file descriptor (fd) forcommand/procexitlolgetdents64to read directory entries -linux_direntstructure link
Notice a magic number: 19 offset to d_name, 16 for d_reclen. Check above link for structure brekadown
Telemetry
This is malware development blog, it is called maldevblog lol, but I am a detection engineer at heart. I also believe that red team should serve blue team. I ALSO BELIEVE THAT THE BEST DETECTIONS ARE PRODUCED BY RUNNING ACTUAL TOOLS AND TTPs. Do NOT write without telemetry generated, please, DO NOT ASSUME, do the thing, look what’s there and write the logic.
Auditd
I am getting nostalgic, auditd is something I have been playing with years ago, before eBPF. I recall also MDE agent using auditd (now they upgraded to eBPF).
I know some people are still using it, so let’s explore.
Let’s think about the behavior for a second: what’s actually happening - we are opening a lot of /proc/<PID>/comm files, thus I would expect to observe a spike of syscall (2) open against /proc/ directory (technically subdirectories).
The easiest auditd rule you can add to see this activity: sudo auditctl -w /proc/ -p r -k proc_read (this is not persistent way of adding this, fyi)
After rerunning the program and inspecting the log file: `cat /var/log/audit/audit.log | grep proc_read | grep ‘comm=“proc”’:
type=SYSCALL msg=audit(1784295498.869:1361): arch=c000003e syscall=2 success=yes exit=4 a0=402418 a1=0 a2=0 a3=0 items=1 ppid=10018 pid=10085 auid=1000 uid=1000 gid=1000 euid=1000 suid=1000 fsuid=1000 egid=1000 sgid=1000 fsgid=1000 tty=pts1 ses=3 comm="proc" exe="/home/pawel/proc" subj=unconfined key="proc_read"ARCH=x86_64 SYSCALL=open AUID="pawel" UID="pawel" GID="pawel" EUID="pawel" SUID="pawel" FSUID="pawel" EGID="pawel" SGID="pawel" FSGID="pawel"
Well, we have all the details that we need, users pids etc. In total I had over 350 of the same log like above. So in theory you could write a detection logic that would look for same pid generating many reads on /proc/ directory.
SYSCALL event type is not the only type of events that are getting generated from this activity, each SYSCALL event would also have corresponding event types that you can correlated on unique event id (in above event case it would be 1784295498.869:1361):
pawel@ubuntu-box:~/kernel_exercise_6.2$ cat /var/log/audit/audit.log | grep "1784295498.869:1361"
type=SYSCALL msg=audit(1784295498.869:1361): arch=c000003e syscall=2 success=yes exit=4 a0=402418 a1=0 a2=0 a3=0 items=1 ppid=10018 pid=10085 auid=1000 uid=1000 gid=1000 euid=1000 suid=1000 fsuid=1000 egid=1000 sgid=1000 fsgid=1000 tty=pts1 ses=3 comm="proc" exe="/home/pawel/proc" subj=unconfined key="proc_read"ARCH=x86_64 SYSCALL=open AUID="pawel" UID="pawel" GID="pawel" EUID="pawel" SUID="pawel" FSUID="pawel" EGID="pawel" SGID="pawel" FSGID="pawel"
type=CWD msg=audit(1784295498.869:1361): cwd="/home/pawel"
type=PATH msg=audit(1784295498.869:1361): item=0 name="/proc/10085/comm" inode=66925 dev=00:18 mode=0100644 ouid=1000 ogid=1000 rdev=00:00 nametype=NORMAL cap_fp=0 cap_fi=0 cap_fe=0 cap_fver=0 cap_frootid=0OUID="pawel" OGID="pawel"
type=PROCTITLE msg=audit(1784295498.869:1361): proctitle="./proc"
From this the most interesting would the PATH event type as it records the details about what file was open.
This presents the pain point of auditd. Thing is split into multiple event types and you would need to perform more work in order to correlate these together so you can work with these in your SIEM of choice. SUCKS.
What’s more, the rule I provided you is noisy as f. There are processes in Linux that are constantly opening /proc so you would need somehow to do some baselining and exclude these.
Below you can find a simple dump from ubuntu vm that’s been running only for couple of mins:
pawel@ubuntu-box:~/kernel_exercise_6.2$ grep proc_read /var/log/audit/audit.log | grep -v 'comm="proc"' | grep -o 'comm="[^"]*"' | cut -d '"' -f 2 | sort | uniq -c | sort -nr
   2472 fuser
   1358 (fwupd)
    476 vmtoolsd
    382 (fwupdmgr)
    142 tar
    135 dpkg
    109 snap
     98 snap-confine
     85 gsd-housekeepin
     84 9
     82 sadc
     78 http
     68 (python3)
     63 gnome-shell
     51 apt-config
     40 gpgconf
     39 sudo
     36 apt
     35 firmware-notifi
     32 gpg-connect-age
     28 snap-update-ns
     28 (snap)
     27 node
     27 grep
     24 gpgv
     18 sed
     14 snap-seccomp
     14 snap-exec
     14 snapctl
     14 ln
     12 https
     11 npm
     10 (sa1)
     10 cron
     10 apt-check
and more...
I hope it is clear: DO NOT USE IT IN PRODUCTION. We explore, we check, we learn. Most likely it will be not worth to detect this kind of activity (wtf, you ask).
So why do you even bother? Because we learn and applying same methodology and deep understanding of what telemetry is generated (by coding stuff yourself, understanding how it is build) by performing the activities.
If you recall the code and the few notes I have left there for you about syscalls, you will notice that there are more calls we have made. Why cannot we also track these different calls? Yes, oh yes we can. While it is not really smart to go after the write and other common ones, the getdents64 is odd, perhaps you have never seen that before. Track it with this rule (not persistent):
sudo auditctl -a always,exit -F arch=b64 -S getdents64 -k track_getdents
You will see quite a few events like these:
type=SYSCALL msg=audit(1784392977.876:25424): arch=c000003e syscall=217 success=yes exit=0 a0=3 a1=402018 a2=400 a3=0 items=0 ppid=3988 pid=9953 auid=1000 uid=1000 gid=1000 euid=1000 suid=1000 fsuid=1000 egid=1000 sgid=1000 fsgid=1000 tty=pts0 ses=9 comm="proc" exe="/home/pawel/proc" subj=unconfined key="track_getdents"ARCH=x86_64 SYSCALL=getdents64 AUID="pawel" UID="pawel" GID="pawel" EUID="pawel" SUID="pawel" FSUID="pawel" EGID="pawel" SGID="pawel" FSGID="pawel"
type=PROCTITLE msg=audit(1784392977.876:25424): proctitle="./proc"
Interestingly, there is no PATH event type. What’s more, this is yet again, noisy as f…, if you have this rule and perform simple ls /home it will also trigger. So yet again, NOT really somethign I would put on production environment without heavy filtering etc.
The reason that there is not PATH event is that getdents64 is working on fd (File Descriptor). /proc is dynamically generated, so it does not really have an inode. So you cannot do auditd rule with -F dir=/proc/. (Assumptions, but testing confirms it).
eBPF
eBPF is quite a new topic for me. I know it is the new hot, new shiny and it is suuuper cool when you look at it and what it can give you. I will not waste time explaining what it is and how it works, you can google or fancy your awesome AI models (I know you use them, you sneaky sneaky boyo). What it remainds me is your typical kernel driver for Windows. However, we can utilize bpftool to load it and attach without building user-space program (yey!). You build driver part and then user-mode app that talks with the driver via Irp requests etc. With eBPF we can build this tracking module that will print us a message whenever someone opens /proc.
I decided to utilize BPF LSM (Linux 5.7+ I believe). So we utilize SEC("lsm/file_open") for our use case. I understand this as this additional layer of abstraction so we do not program every other different syscall tracking that could be utilized to open like open(), openat() etc. On the other hand we loose the actual syscall context that was performed. I mean tradeoffs am I right?
When it comes to the rest of the code I just read chapter 5 of “Learning eBPF” by Liz Rice, it is great, and does better job explaining various stuff than I would ever do.
What is interesting is this line sweet reference:
magic = BPF_CORE_READ(file, f_inode, i_sb, s_magic);
This macro just allows us to derefeference every pointer in this struct. file struct has inode struct and inode struct has super block struct that holds lots of details about filesystem: link. One of these is this magic. That is this magic signature.
Cool stack overflow moment: what do header linux/magic.h […]do?
If you fancy traversing structures yourself, here you go (once you generated vmlinux.h):
grep -A 30 "struct file {" vmlinux.h
grep -A 30 "struct inode {" vmlinux.h
grep -A 30 "struct super_block {" vmlinux.h
Magic value can be obtained via:
cat /usr/include/linux/magic.h | grep PROC_SUPER_MAGIC
stat command is using these values to determine the filesystem:
pawel@debox:~$ stat -f /proc
  File: "/proc"
    ID: 1700000000 Namelen: 255     Type: proc
Block size: 4096       Fundamental block size: 4096
Blocks: Total: 0          Free: 0          Available: 0
Inodes: Total: 0          Free: 0
pawel@debox:~$ stat -f -c %t /proc
9fa0
Genereate vmlinux.h headers:
bpftool btf dump file /sys/kernel/btf/vmlinux format c > vmlinux.h
The Code:
#include "vmlinux.h"
#include <bpf/bpf_helpers.h>
#include <bpf/bpf_tracing.h>
#include <bpf/bpf_core_read.h>

#define PROC_SUPER_MAGIC 0x9fa0 //identify /proc

char __license[] SEC("license") = "GPL";

SEC("lsm/file_open")
int BPF_PROG(track_proc_open, struct file *file)
{
    long magic;
    const unsigned char *name;
    char buf[32];

    magic = BPF_CORE_READ(file, f_inode, i_sb, s_magic);

    if (magic != PROC_SUPER_MAGIC) {
        return 0;
    }

    name = BPF_CORE_READ(file, f_path.dentry, d_name.name);
    bpf_probe_read_kernel_str(buf, sizeof(buf), name);

    pid_t pid = bpf_get_current_pid_tgid() >> 32;
    bpf_printk("PID %d opened a file in /proc: %s\n", pid, buf);

    return 0;
}
Build:
clang -g -O2 -target bpf -c proc_watchdog.bpf.c -o proc_watchdog.bpf.o
sudo bpftool prog loadall proc_watchdog.bpf.o /sys/fs/bpf/proc_watchdog autoattach
Check output:
sudo cat /sys/kernel/tracing/trace_pipe
Output:
            proc-1166    [000] ...11  1350.725753: bpf_trace_printk: PID 1166 opened a file in /proc: comm

            proc-1166    [000] ...11  1350.725758: bpf_trace_printk: PID 1166 opened a file in /proc: comm

            proc-1166    [000] ...11  1350.725763: bpf_trace_printk: PID 1166 opened a file in /proc: comm

            proc-1166    [000] ...11  1350.725768: bpf_trace_printk: PID 1166 opened a file in /proc: comm
            [...] and lots of lines
Remove:
sudo rm -rf /sys/fs/bpf/proc_watchdog
Where it fails (potential hardening)
I am not the best Linux tech out there, but I am aware of shortcomings of this technique (process enumeration with /proc directory). Example would be:
https://www.redhat.com/en/blog/hidepid-linux-hide-pid
If you run this command:
$ sudo mount -o remount,rw,nosuid,nodev,noexec,relatime,hidepid=2 /proc
And then execute our little program, you will be presented only with processes that are owned by the user that run the program, I guess it is related to capabilities or smth. Nevertheless, if you run the program as root you will see everything.
.EOF